How is this data collected?
The Bath BID invests in smart data technology which monitors and reports on footfall, visitor profiling and VISA spend.
Footfall experts, Springboard (https://www.spring-board.info/) provide reports on footfall, collected from 10 footfall counters in Bath city centre, to determine the footfall count.
Movement Insights (https://www.movementstrategies.com/movement-insights/home) provides reports on VISA spend across the city and demographic information about city users from mobile phone usage. This data is analysed and compiled into a dashboard.
The Bath BID have recently been comparing the recovery during the day time and night time visitor economy. To illustrate the difference, the Bath BID have taken the two time periods at 01:00-01:59 and 13:00-13:59 to present a direct comparison.
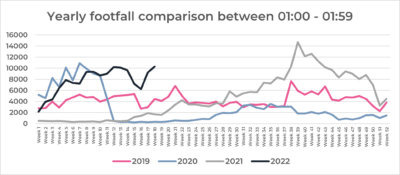
Table 1: 1am – 2am yearly comparison (2019 – 2022)
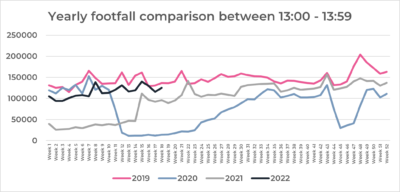
Table 2: 1pm – 2pm yearly comparison (2019 – 2022)
What the graphs show is that whilst Bath is yet to get back to 2019 footfall rates during the day, there has been an uptick in footfall during the later evening (night-time economy).
Analysing the data
To understand where the evening economy is strongest, the Bath BID have considered the time period in the graphs below.
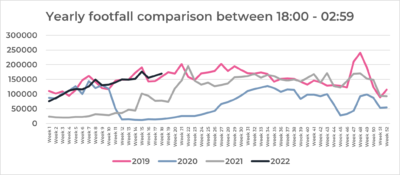
Table 3: 18:00 – 02:59 yearly footfall comparison
When the hourly capture is extended to cover 18:00 – 02:59 the footfall rate for 2022 drops relative to 2019. Footfall remains slightly below 2022 levels until Week 16 of 2022 (17th – 23rd April) when the footfall rate increases in comparison to 2019.
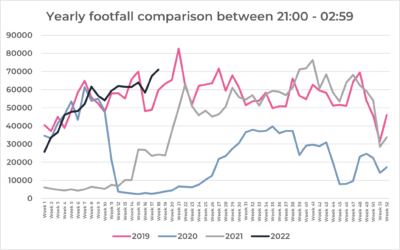
Table 4: 21:00 – 02:59 Yearly footfall comparison
Further limiting the time period under consideration to only the later evening between 21:00 – 02:59 2022 footfall comfortably surpasses 2019 footfall levels particularly during holiday periods.
What does this tell us?
Our comparison of the daytime and nighttime footfall clearly demonstrates that the later evening economy between 21:00 – 02:59 is comfortably surpassing 2019 levels, whereas the earlier evening between 18:00 – 20:59 is tracking 2019 rates.
In order to understand the reason for this difference, we have looked at the mobile phone data which splits city centre users into residents (BA1 and BA2 postcodes) with workers (people who appear in the city on a regular basis but don’t live in BA1 and BA2). See the graph below which shows that while residents are now regularly appearing in our data at pre-COVID levels, workers are typically only present at approximately 30% of 2019 levels. This will naturally have an impact on the early evening footfall counts.
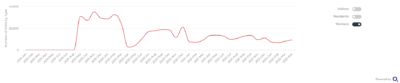
Table 5: Count of visits by visitor type
Further exploration of our data shows positive news for the hospitality sectors with Q3 and Q4 restaurant spend higher than Q4 2019. Other notable changes are the lower spend levels between Q4 2019 and Q4 2022 on most items apart from hotels, leisure and restaurants. Please refer to appendix one for label definitions.
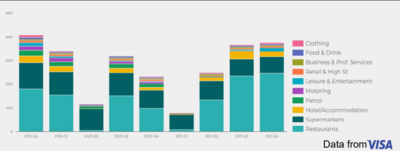
Table 6: Total Visa spend for Bath between 6pm and 6am
There are reasons to be positive about the outlook for Bath City Centre, with businesses and investors embracing the hospitality opportunities as reflected in the new city centre openings in all areas for example Square Grill, Nook, Dough Pizza in Kingsmead Square, Tortilla UK, Coppa Club.