As lockdown has eased over the past few months, we have seen a gradual increase in footfall in Bath city centre. Thanks to the recent reopening of indoor hospitality and the fantastic weather in Bath, the Spring Bank Holiday Monday on 31st May was the first day in 2021 where footfall was higher than on the same day in 2018.
Analysis of the Bath BID’s visitor profiling shows that the recent increase in city centre footfall is mainly due to the return of visitors to the city, rather than an increase in office workers getting back into the office. Notably, there are still very few international visitors in the city, which makes current city centre footfall levels even more impressive.
Are Workers Returning to the City Centre?
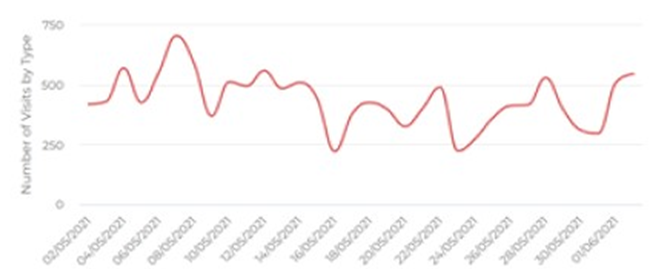
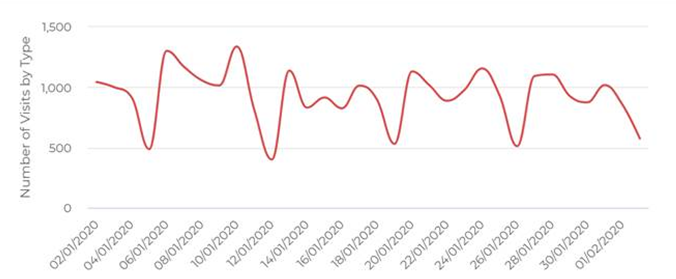
For our visitor profiling data, a worker is somebody whose mobile phone regularly appeared in the city on weekdays prior to the COVID-19 pandemic. Workers with new phones, or those who have started work at a Bath-based business more recently, may not yet be classed as workers, depending on how often they are now coming into the city centre.
The below graphs show that pre-COVID, the typical phone count for workers was between 1,000 and 1,500. Now, that figure rarely surpasses 500. It will be interesting to see how this picture changes when the government’s homeworking guidance is relaxed.

Number of Visits by Type (Workers)
Number of Visits by Type (Workers)
How Have Visitor and Resident Numbers Increased Over the Past Few Months?
For our visitor data profiling, residents are people with BA1 and BA2 home addresses. Visitors are everybody else (non-regular non-locals).
The below graphs show a gradual increase in visitors to the city centre as lockdown has eased, with the number of visitors to the city centre now reaching pre-COVID levels.
The difference in the number of visitors vs workers that are regularly in the city centre also point to the importance of visitors to Bath’s high street.
Number of Visits by Type (Visitors)
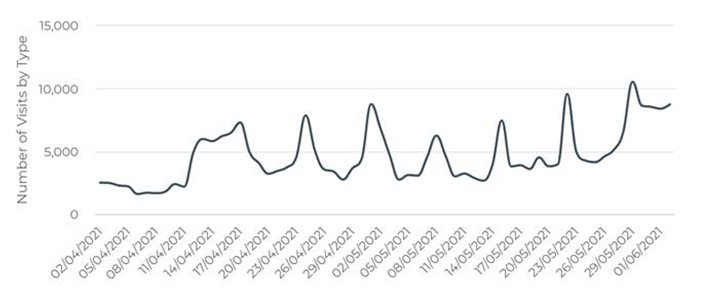
Number of Visits by Type (Visitors)
The below graph shows that numbers of residents in the city centre have not shifted as much as with visitors.
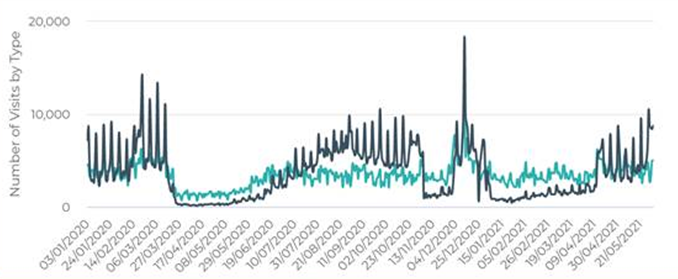
Number of Visits by Type (Visitors in Black, Residents in Green)
What Demographics of People Are Spending Time in the City Centre?
Although the visitor type and distance travelled to the city centre has changed since before the pandemic, the type of person spending time in the city centre is very similar.
In Q2 of 2021, the people spending the most time in the city centre were women ages 45 to 54, closely followed by women aged 25 to 34. This was the same in Q1 of 2020.
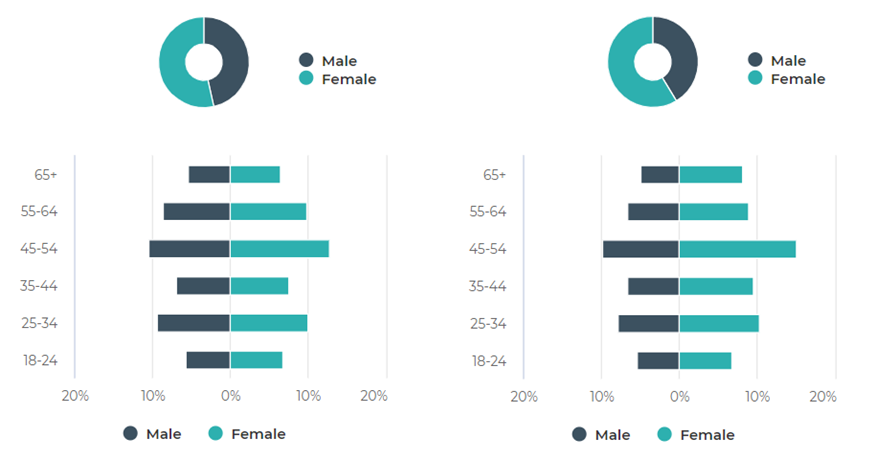
Visitor Demographics Q1 2021 vs Q1 2020
In Q1 of 2021, 38% of people in the city centre had a Very High spend power, and 25% of people had a High spend power. In Q1 of 2020, these figures were very similar – 37% of people had a Very High spend power, and 26% of people had a high spend power.
Spend power conveys propensity to spend. This is modelled on a combination of several measures, including mobile devices cost and frequency of upgrades, home location, and frequency and distance from home of holidays.
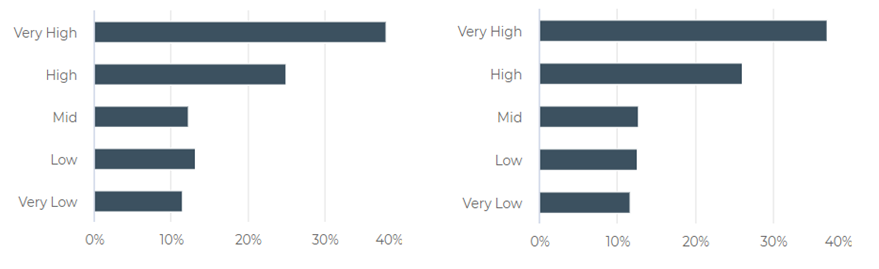
Spend Power Q1 2021 vs Q1 2020
How Is Our Data Calculated?
The Bath BID’s Smart City Data Project was launched in 2019. The initiative was developed in response to requests from Bath BID Levy Payers who sought a fuller understanding of the profile of visitors in the city.
Demographic information is generated from mobile phones connecting to the local O2 network. Advanced modelling is applied to extrapolate volumes to all presence in Bath, not just those on the O2 network. All data is anonymised and aggregated to protect individual privacy and is GDPR compliant.